Case Study: How We Grew a Belgian Fashion Brand's Online Revenue by 180% in 12 Months
Most fashion brands we speak to for the first time share a common story: they've been running Meta ads for 6 to 12 months, the ROAS looks reasonable on paper, but the business is not actually growing. Revenue is flat, the ad account is eating budget, and the founders can't figure out why.
This is the story of one of those brands - and what happened when we looked under the hood.
Key Takeaways
- •The brand had decent Meta ROAS on paper but flat revenue growth - a classic attribution illusion
- •We found three root problems: weak store conversion rate, no email retention system, and creative fatigue
- •We fixed them in sequence - store first, email second, paid media third
- •12 months later: online revenue up 180%, repeat purchase rate up from 18% to 34%, email now drives meaningful incremental revenue
- •The lesson: paid media is an accelerant, not a foundation. Fix the fundamentals first.
The Brand and Where They Stood
The client is a Belgian women's fashion brand - contemporary price point, an average order value around €130, selling primarily to Belgian and Dutch customers. They had been in business for four years and had a loyal offline customer base. Their Shopify store had been live for two years.
When they came to us, they were spending around €8,000 per month on Meta ads — above the typical benchmark for their phase. See our Meta Ads benchmarks guide for the numbers by revenue stage. The reported ROAS in Meta Ads Manager was sitting at 3.1x. On the surface: not bad.
But when we looked at their actual revenue numbers - total Shopify revenue, not just Meta-attributed - something didn't add up. The business was generating roughly the same monthly revenue it had been generating six months earlier. If Meta was truly delivering a 3.1x return, growth should have been visible in the P&L. It wasn't.
This is one of the most common traps we see. Meta's attribution window - by default 7-day click, 1-day view - credits purchases that often would have happened anyway: direct visitors, returning customers, email openers who also clicked a retargeting ad. The reported ROAS looked good. The actual incremental revenue from ads was a fraction of that.
The brand was spending €8K/month on Meta. Reported ROAS: 3.1x. But total revenue hadn't moved in 6 months. Mobile CVR: 1.1%. The store was the bottleneck - not the ads.
Seeing similar numbers in your account? We do free Meta campaign audits. Book yours here.
Step 1: Audit Everything Before Touching the Ads
Our first rule: never adjust the ad account before you understand the full picture. We ran a full audit across three areas - the store, the email account, and the ad account.
What we found in the store: The overall conversion rate was 1.1% on mobile, 1.9% on desktop. For a contemporary fashion brand at this price point, mobile conversion was low. When we dug into the session recordings, the problem was clear: product pages had only two photos per item, no size guide visible without scrolling, and the checkout required account creation before purchase.
What we found in email: The brand had Klaviyo set up, but only with a welcome flow and an abandoned cart flow. The welcome flow had a 38% open rate on the first email - strong - but dropped to 11% by email three because the sequence had no fashion-specific content, just generic discount nudges. The abandoned cart flow was sending three emails in 24 hours, which was creating unsubscribes. There were no post-purchase flows, no browse abandonment, no winback.
What we found in the ad account: Heavy creative fatigue. The top three ads had been running for more than four months with no refresh. The audience setup was reasonable, but the budget allocation was almost entirely on retargeting - the brand was essentially paying to reach people who already knew them, at high frequency, with the same tired creative.
Not sure if your store, email, or ad account is the bottleneck? We'll tell you within 48 hours. Book a free audit.
The Roadmap: Fix in Sequence
We laid out a 12-month plan in three phases. The principle: you don't pour more water into a leaky bucket. Fix the store conversion first, build the retention system second, then scale paid media third.
Many brands want to jump straight to increasing ad budget. We pushed back. With a 1.1% mobile CVR, every extra euro of paid traffic was converting at half the efficiency it could. Fix the store first — our fashion brand growth stages guide explains exactly how to sequence this — and the same budget suddenly delivers twice the output.
Phase 1 - Store Optimisation (Months 1-3)

We worked with the brand's Shopify developer to implement a series of product page changes.
First, we expanded product photography. Every item went from two images to a minimum of five - including a flat lay, a detail shot, and at least one styled look. For top-selling SKUs, we added a short video showing the fabric texture and drape. Mobile add-to-cart rate increased noticeably within the first month.
Second, we redesigned the size selector. Instead of a dropdown, we implemented a visual size guide that opened inline on the product page - no new tab, no modal that covered the product. Returns due to size issues dropped, and more importantly, the hesitation that was killing mobile conversion decreased.
Third, we removed the forced account creation at checkout. Guest checkout only, account creation as an optional post-purchase step. This single change moved mobile CVR from 1.1% to 1.6% - a 45% relative improvement.
By month three, overall store conversion was at 1.7% mobile, 2.4% desktop. Not the highest we've seen for this price point, but a material improvement that meant every subsequent marketing euro was working harder.
Phase 2 - Email and Retention (Months 2-5)
We started the email rebuild in parallel with the store work, because flows take time to accumulate data.
The welcome series was rebuilt from scratch. Instead of four discount-heavy emails in five days, we created a seven-email sequence over 21 days. Email one: brand story, no discount. Email two: the brand's design process with editorial imagery. Email three: bestsellers with social proof. Email four: a soft offer (10% off, first purchase). Email five: new arrivals. Email six: care instructions and community (brand values). Email seven: final nudge for non-openers.
Open rates on the new welcome series averaged 44% across the sequence - up from the 20% average on the old one. More importantly: revenue per recipient from the welcome flow increased significantly, because we were warming up subscribers before hitting them with an offer.
We added a browse abandonment flow triggered after 30 minutes of inactivity, a post-purchase flow focused on styling inspiration and cross-sell rather than immediate re-purchase nudges (fashion customers don't buy again in 48 hours - they need to wear the first piece first), and a winback flow targeting customers who hadn't purchased in 90 days.
We also reset the campaign frequency. The brand had been sending 3-4 campaigns per week. We pulled it back to 1-2, focused on collection drops and editorial content rather than promotional blasts. Unsubscribe rate dropped from 0.9% per send to 0.3%.
Phase 3 - Paid Media Scale (Months 4-12)
With a better-converting store and a functioning retention system in place, we turned our attention to the ad account.
The first change was creative. We briefed a new batch of 12 creative assets - a mix of static lifestyle imagery, short-form video with a strong product hook in the first two seconds, and one UGC-style clip from an existing customer. We retired the four-month-old fatigue ads immediately.
The second change was budget allocation. We shifted from 80% retargeting / 20% prospecting to 50/50, then eventually 40/60 as new creative proved its prospecting performance. Retargeting an audience that's already seen your creative 20 times is expensive and inefficient. You grow by reaching new people, not by hammering the same audience.
We also introduced a proper MER (Marketing Efficiency Ratio) framework - total ad spend divided by total revenue - as the primary metric for evaluating the account, rather than the in-platform ROAS. This immediately revealed that some campaigns that looked strong in Meta were not contributing to overall revenue growth. We cut them.
By month six, the MER had improved from 3.1 (the original reported ROAS) to a verified 3.8 when measured against actual total revenue. By month 12, it was at 4.4.
Want to know what your real MER is? We'll calculate it for free and show you where your budget is actually going. Book a call.
The Results After 12 Months
Here is where the brand stood at month twelve compared to their starting point:
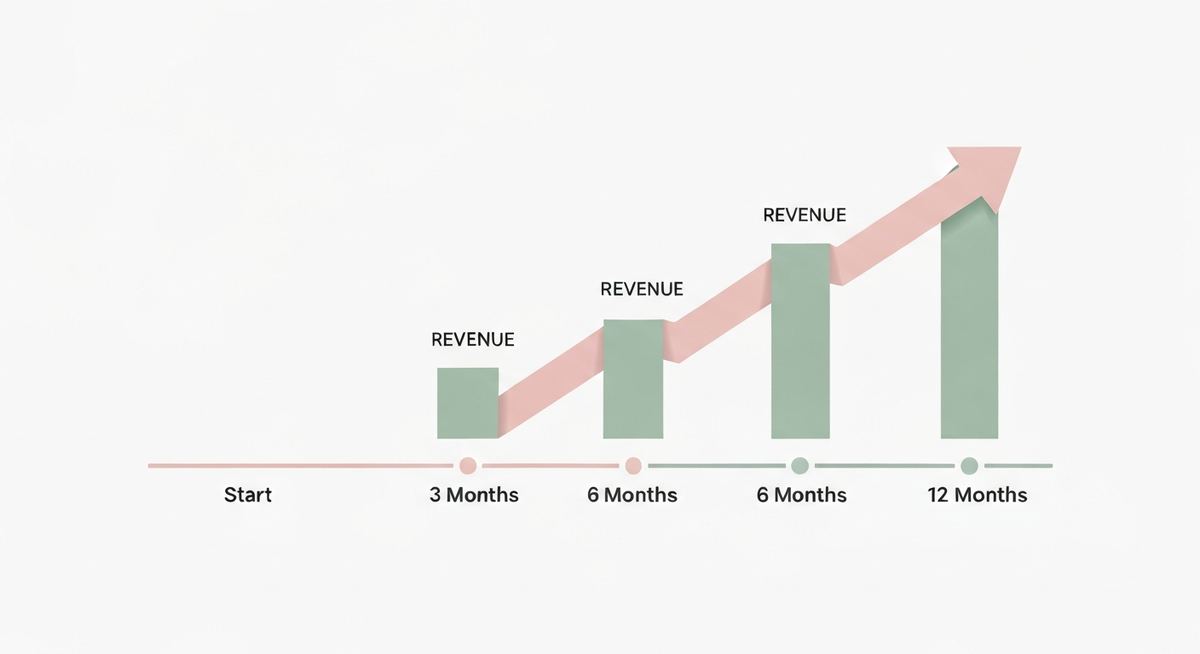
After 12 months: Online revenue +180% | Mobile CVR 1.1% → 1.9% | Repeat purchase rate 18% → 34% | MER 3.1 → 4.4 | Ad budget scaled from €8K to €18K/month - at higher efficiency.
Online revenue: +180% year-over-year | Mobile CVR: 1.1% → 1.9% | Repeat purchase rate: 18% → 34% | Email unsubscribe rate: 0.9% → 0.3% per send | MER: 3.1 → 4.4 | Monthly ad budget: €8K → €18K (at higher efficiency)
The revenue increase came from three compounding sources: more efficient conversion of existing traffic, stronger retention driving repeat purchases, and more efficient acquisition enabling us to scale the budget without degrading returns.
The brand went from flat growth to compounding growth. That's the difference between a business that's running to stand still and one that's building momentum.
What We Learned From This Project
A few things stood out from this engagement that we've since seen confirmed across other clients.
First: reported ROAS and actual incremental revenue are almost never the same number. If you're not tracking MER alongside in-platform metrics, you don't have the full picture. This is not a knock on Meta - it's a structural reality of multi-touch attribution. Every platform over-counts its own contribution to some degree.
Second: the order of operations matters more than most brands realise. We've seen brands pour €20K per month into Meta ads with a 0.8% mobile conversion rate. They're not getting a good return because the store is broken - and more budget doesn't fix a broken store.
Third: email's role is retention, not revenue padding. The brands that get the most from Klaviyo are the ones who use it to build relationships with existing buyers - not the ones who send five campaigns a week chasing short-term revenue attribution. The best performing email programmes we manage have the lowest send frequency.
Frequently Asked Questions
Every brand's situation is different. The right sequence - and the right ambition for what's achievable in 12 months - depends on your margin, your price point, your starting point, and your team's capacity. If you want to know what the right approach looks like for your specific brand, we're happy to take a look.
Book a free strategy session with Landing Partners. No pitch, no hard sell - just a clear view of where you stand and what to do next. Book here.