Klaviyo Email Benchmarks for Fashion Brands in 2026
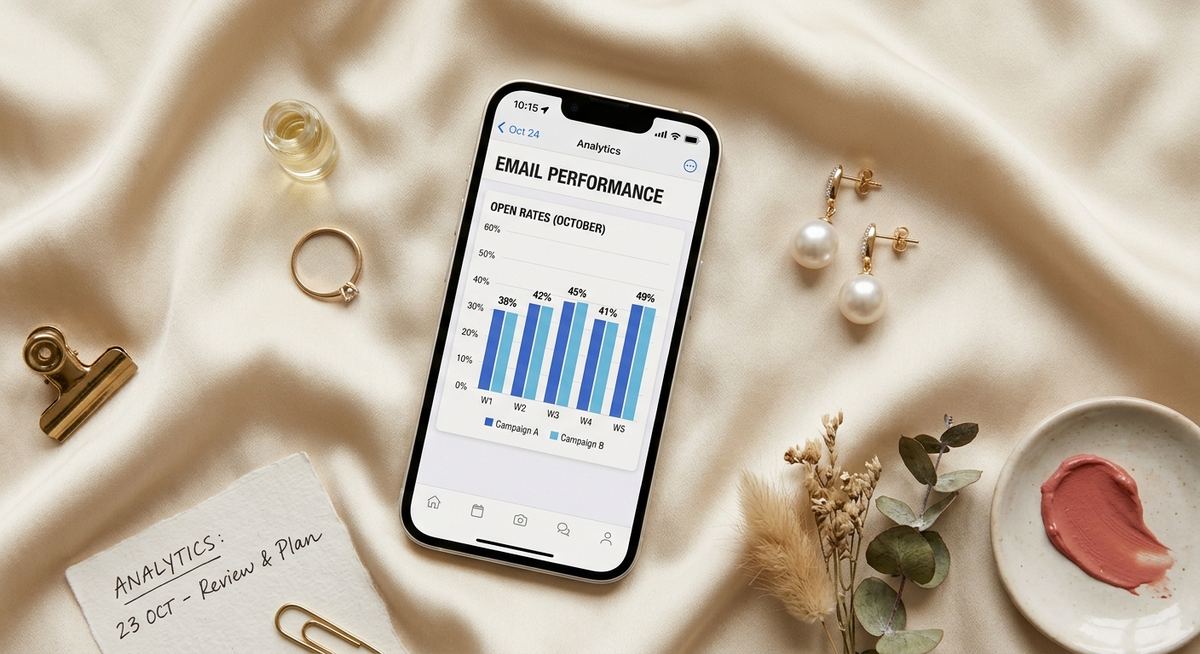
Most Klaviyo benchmarks you find online are averages across every industry - from SaaS to supplements to pet food. For fashion, they are almost useless. And they tell you nothing about how your email performance stacks up against the advertising budget stages where email starts to pull serious revenue weight.
Key Takeaways
- •Fashion email benchmarks vary by flow type, price point, and season. There is no single 'healthy' number.
- •Welcome series consistently drives the highest revenue per recipient of any flow. For time-sensitive moments — drops, flash sales, restocks — complement it with Klaviyo SMS for fashion brands, where open rates exceed 90%.
- •Back-in-stock alerts have the highest open rates we track - often above 55% when sent within 2 hours of restock.
- •Q4 open rates drop 10-15% across the board as inbox competition surges during BFCM. Use a proper fashion email marketing calendar to plan your send cadence before September.
- •Klaviyo's 5-day attribution window inflates campaign revenue numbers. Evaluate flows by revenue per recipient, not total attributed revenue.
Fashion is different from most categories in email marketing - longer purchase cycles, strong seasonality, and sub-sector variation that makes cross-industry benchmarks actively misleading.
Based on our work with 40+ active fashion clients, here is what we actually see.
Why Fashion Email Data Looks Different
Three things set fashion apart.
First: the consideration window. Someone deciding on a €180 coat behaves differently from someone buying a €30 supplement. The intent that comes with browsing fashion is longer-lived and more emotional. Email timing and content need to reflect that.
Second: seasonality. January (post-sales, low intent) and October (pre-BFCM, high intent) produce completely different list behaviours. Comparing your Q1 numbers to Q4 and calling one 'bad' misses the picture entirely. For a full breakdown of the key email moments across the year, see our fashion email marketing calendar.
Third: sub-sector variation. A luxury accessories brand at €250 AOV has a completely different list dynamic than a streetwear brand at €70. Open rates, click rates, and flow revenue all shift with price point and brand positioning.
Want to know where your Klaviyo numbers stand against our client base? Book a free email audit and we'll run the comparison.
Welcome Series: The Flow With the Highest Return
Across our client base, welcome flows consistently drive more revenue per subscriber than any other automation. This is not surprising - the moment someone signs up is their highest-engagement point.
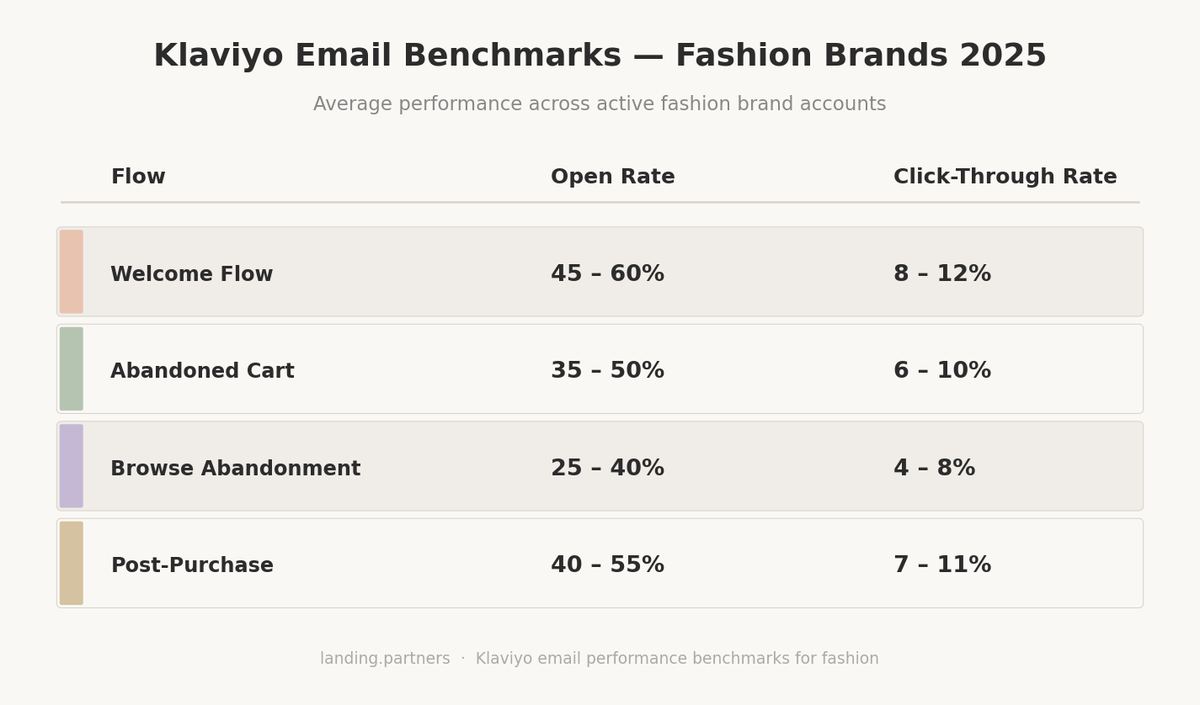
Welcome series (our client data): Open rate email 1: 48-62%. Open rate emails 2-3: 30-42%. Click rate: 4-7%.
The drop-off between email 1 and email 2 is where most brands lose value. Email 1 rides fresh intent. Email 2 has to earn the click.
The best welcome flows we see are three-email sequences, not single discount sends. Email 1 delivers the offer and brand welcome. Email 2 tells the brand story. Email 3 surfaces best-sellers or the current collection. Brands running this structure consistently outperform single-email setups in first-30-day subscriber revenue.
Abandoned Cart: High Intent, Low Margin for Error
Abandoned cart is the most commonly set up flow — and the most commonly misconfigured. If you want to see the full setup, our guide to Klaviyo flows for fashion brands covers each flow with timing, triggers and real examples.
Abandoned cart (our client data): Open rate 38-52%. Click rate 5-9%.
The most common mistake: triggering too fast. Many brands send the first cart email within 15 minutes. For fashion, where a €150 purchase might involve 2-3 revisits before buying, this often interrupts someone still in the consideration process. For most fashion price points, a 1-2 hour trigger window outperforms 15-30 minutes.
Subject line specificity matters here. 'You left something behind' works for impulse categories. For fashion, dynamic product names in the subject - 'Your [Product Name] is still waiting' - lift open rates consistently in our data.
Browse Abandonment: Lower Numbers, Underrated Volume
Browse abandonment has lower individual performance than cart flows - but because volume is much higher, total revenue contribution is often underestimated.
Browse abandonment (our client data): Open rate 28-40%. Click rate 3-5%.
One caveat: browse abandonment only works when your list is engaged. Sending to a disengaged list accelerates unsubscribes more than it drives revenue.
In fashion, browse abandonment performs better when framed around categories than individual products. 'You were browsing our new arrivals' tends to outperform 'You looked at this item', because discovery intent is broader. Someone browsing coats is open to multiple options - not necessarily attached to the one they viewed last.
Post-Purchase Flows: Where Retention Actually Starts
The post-purchase flow is consistently underbuilt at brands that come to us for audits. If you're starting from scratch, follow our Klaviyo setup guide to get the foundation right first. The typical setup: an order confirmation and a generic 'hope you love it' follow-up two days later.
Post-purchase (our client data): Open rate 42-58%. Click rate 4-7%.
The brands extracting real value from post-purchase flows use them to build context: care instructions, styling guidance, brand story, and review requests timed to after the product has been worn. For brands weighing platform options, our Klaviyo vs Mailchimp guide covers what matters most for fashion stores. Post-purchase is a relationship-building tool that happens to drive retention - not just a logistics notification.
Timing is critical here. A review request sent the day after delivery is ignored. Sent 7-10 days later, when the product has been worn, it converts meaningfully and generates the social proof that lifts product page conversion for the next buyer.
Not sure if your post-purchase flow is building retention or just ticking a box? Book a free Klaviyo audit - we'll review your full flow structure.
Winback Flows: Worth Running, Even With Low Numbers
Winback flows have the lowest metrics of any automated flow - by design. You are emailing people who have not engaged with your brand in months.
Winback (our client data): Open rate 12-22%. Click rate 1.5-3.5%.
These numbers look low. But the cost of running a winback flow once built is near zero, and even 2% of a lapsed segment converting represents revenue that would otherwise be lost.
The more important winback decision: when to suppress. Subscribers who do not engage with your winback sequence should be removed from your active list. Continuing to email chronically unengaged contacts damages your sender reputation and depresses deliverability across your entire list.
The right winback window is brand-dependent. For a brand that typically sees 2-3 purchases per year, 90 days of inactivity is meaningful. For brands with mostly one-time buyers, 180 days is a better trigger. There is no universal rule.
Back-in-Stock Alerts: The Highest Open Rates We Track
Back-in-stock alerts are the strongest individual performers in our client data when triggered quickly. The mechanism is simple: a subscriber who signed up to be notified is actively interested in a specific item.
Back-in-stock (our client data): Open rate 55-72%. Click rate 10-18%.
Speed is the primary variable. Back-in-stock emails lose roughly half their click rate if sent more than 4 hours after restock. The subscriber's interest is real but time-limited - they are likely watching multiple brands in the same category.
One pattern: back-in-stock performs best for limited or seasonal items. For permanently available products, the urgency signal weakens and performance drops accordingly.
How Seasonality Affects Every Benchmark Above
The ranges in every section above are partly driven by season.
In November, inbox competition is at its annual peak. Every brand your subscribers follow is sending more, and average open rates drop 10-15% versus the annual average. This is expected - it is not a sign that your content deteriorated.
January and February are the opposite. Post-holiday inboxes clear out, and engaged subscribers are easier to reach. Brands that stay active in the inbox through Q1 often see above-average open rates in these months.
Seasonality is also brand-type dependent. For kidswear and teenswear brands, September is often the highest-engagement period of the year - sometimes outperforming BFCM. For gifting and jewellery brands, Valentine's Day and Mother's Day are peaks that do not appear in women's fashion data at all. Never interpret your seasonal numbers against a universal fashion calendar - your brand type determines your peaks.
Sub-Sector Differences That Explain Benchmark Variation
Price point and brand positioning are the two biggest predictors of Klaviyo performance variation within fashion.
Higher price point brands (€150+ AOV) tend to have smaller, more engaged lists. Open rates are typically above the ranges listed here. Click rates are strong. But conversion rates from email are lower because the purchase decision takes longer.
Contemporary fashion (€60-150 AOV) is the middle segment - the benchmarks in this article mostly reflect this group.
Streetwear and fast-moving brands at lower price points see strong open rates at launch and drop moments, but list fatigue accelerates faster. Frequency management is more critical for these brands.
Benchmark yourself against your price point and customer type, not against 'fashion' as a category.
What the Best-Performing Brands Do Differently
Across our audits, the fashion brands with the strongest Klaviyo metrics share a consistent pattern across three areas.
List quality over list size. A 10,000-person list at 40% open rates outperforms a 50,000-person list at 15% - not just in performance metrics, but in deliverability, revenue per send, and long-term relationship value. Brands that grow their list without regard for engagement quality pay for it later. Klaviyo list growth pairs best with a solid paid media foundation — see our Meta ads benchmarks for fashion brands for what ROAS and CPMs look like at your stage.
Segmented sends over full-list blasts. Brands that send every campaign to their entire list consistently underperform in click rates and unsubscribe rates. The brands that filter by recency, purchase history, and category preference get materially better numbers with fewer sends.
Per-flow measurement over blended email revenue. Klaviyo's total attributed revenue is inflated by a 5-day click window that credits purchases that would have happened regardless - especially for campaign emails. The metric that tells you whether a specific flow is working is revenue per recipient within the relevant window for that flow.
3 Changes That Consistently Improve Klaviyo Numbers
Based on our audits, these three improvements show up most often as high-impact quick wins:
1. Extend your welcome series to three emails. Most brands have a single welcome email. A three-email sequence - offer, brand story, best-sellers - typically doubles revenue per new subscriber in the first 30 days. The incremental build cost is low; the return is consistent.
2. Suppress your unengaged segment before every campaign. Filter out subscribers who have not opened or clicked in the last 90-120 days before sending campaigns. It reduces your sent volume, but it improves open rates, CTR, and deliverability for the sends that matter.
3. Trigger back-in-stock within 1 hour of restock. If you are batching these triggers overnight or daily, you are running your highest-performing flow type at a fraction of its potential. Automate for same-hour triggering.
Frequently Asked Questions
Every brand's situation is different. Klaviyo benchmarks for fashion depend on your price point, list quality, flow structure, and growth stage. If you want to know how your specific numbers compare - and what the highest-impact change would be - book a free Klaviyo audit.